MX Algebra Graph Quadratic Functions Using Properties

Section 9.6Graph Quadratic Functions Using Properties

Definition

Before you get started, take this readiness quiz.

1

Graph the function \(f(x)={x}^{2}\) by plotting points.
If you missed this problem, review Example 4.
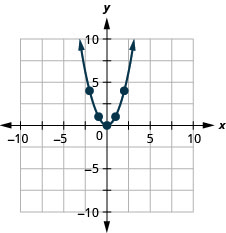
An upward-opening parabola graphed on a Cartesian coordinate system, with its vertex at (0,0) and key points highlighted.
Definition
2

Solve: \(2{x}^{2}+3x-2=0.\)
If you missed this problem, review Example 2.

\(x=\frac{1}{2},\,x=-2\)

Definition
3

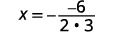
Evaluate \(-\frac{b}{2a}\) when a = 3 and b = −6.
If you missed this problem, review Example 10.

\(1\)

Recognize the Graph of a Quadratic Function

Previously we very briefly looked at the function \(f(x)={x}^{2}\) , which we called the square function. It was one of the first non-linear functions we looked at. Now we will graph functions of the form \(f(x)=a{x}^{2}+bx+c\) if \(a\ne 0.\) We call this kind of function a quadratic function.

Quadratic Function

A quadratic function, where a, b, and c are real numbers and \(a\ne 0,\) is a function of the form

\[f(x)=a{x}^{2}+bx+c\]

We graphed the quadratic function \(f(x)={x}^{2}\) by plotting points.
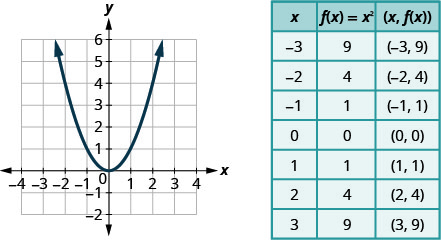
This figure shows an upward-opening parabola graphed on the x y-coordinate plane. The x-axis of the plane runs from negative 4 to 4. The y-axis of the plane runs from negative 2 to 6. The parabola has a vertex at (0, 0) and also passes through the points (-2, 4), (-1, 1), (1, 1), and (2, 4). To the right of the graph is a table of values with 3 columns. The first row is a header row and labels each column, “x”, “f of x equals x squared”, and “the order pair x, f of x.” In row 2, x equals negative 3, f of x equals x squared is 9 and the ordered pair x, f of x is the ordered pair negative 3, 9. In row 3, x equals negative 2, f of x equals x squared is 4 and the ordered pair x, f of x is the ordered pair negative 2, 4. In row 4, x equals negative 1, f of x equals x squared is 1 and the ordered pair x, f of x is the ordered pair negative 1, 1. In row 5, x equals 0, f of x equals x squared is 0 and the ordered pair x, f of x is the ordered pair 0, 0. In row 6, x equals 1, f of x equals x squared is 1 and the ordered pair x, f of x is the ordered pair 1, 1. In row 7, x equals 2, f of x equals x squared is 4 and the ordered pair x, f of x is the ordered pair 2, 4. In row 8, x equals 3, f of x equals x squared is 9 and the ordered pair x, f of x is the ordered pair 3, 9.

Every quadratic function has a graph that looks like this. We call this figure a parabola.

Let’s practice graphing a parabola by plotting a few points.

Example 1

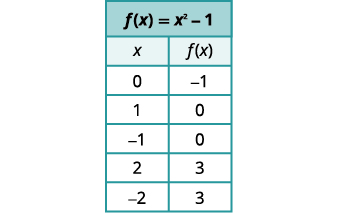
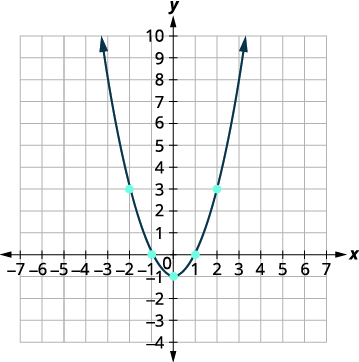
Graph \(f(x)={x}^{2}-1.\)

Choose a few integer values for \(x,\) substitute into the equation, and record the resulting \((x,f(x))\) pairs.

We will graph the function by plotting points.

Table 1
Choose integer values for x,
substitute them into the equation
and simplify to find \(f(x)\) .

Record the values of the ordered pairs in the chart.
A table displays values for the function f(x) = x^2 - 1. For x=0, f(x)=-1. For x=1 and x=-1, f(x)=0. For x=2 and x=-2, f(x)=3.
Plot the points, and then connect
them with a smooth curve. The
result will be the graph of the
function \(f(x)={x}^{2}-1\) .
A quadratic function graphed as an upward-opening parabola on a Cartesian plane, featuring highlighted points at (-2,3), (-1,0), (0,-1), (1,0), and (2,3).
Try It #1

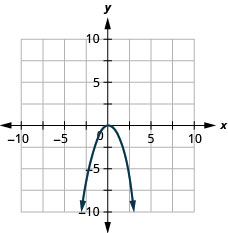
Graph \(f(x)=\text{-}{x}^{2}.\) .

This figure shows an downward-opening parabola graphed on the x y-coordinate plane. The x-axis of the plane runs from negative 10 to 10. The y-axis of the plane runs from negative 10 to 10. The parabola has a vertex at (0, 0).
Did you get it?
Try It #2

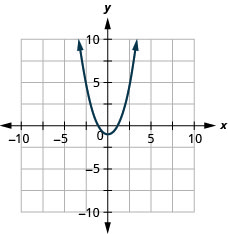
Graph \(f(x)={x}^{2}+1.\)

This figure shows an upward-opening parabola graphed on the x y-coordinate plane. The x-axis of the plane runs from negative 10 to 10. The y-axis of the plane runs from negative 10 to 10. The parabola has a vertex at (0, −1).
Did you get it?

All graphs of quadratic functions of the form f (x) = ax2 + bx + c are parabolas that open upward or downward. See Figure 1.

Figure 1 — Drag a; the leading coefficient's sign determines whether the parabola opens upward (\(a>0\)) or downward (\(a<0\)).

Notice that the only difference in the two functions is the negative sign before the quadratic term (x2 in the equation of the graph in Figure 1). When the quadratic term, is positive, the parabola opens upward, and when the quadratic term is negative, the parabola opens downward.

Parabola Orientation

For the graph of the quadratic function f (x) = ax2 + bx + c, if

This images shows a bulleted list. The first bullet notes that, if a is greater than 0, then the parabola opens upward and shows an image of an upward-opening parabola. The second bullet notes that, if a is less than 0, then the parabola opens downward and shows an image of a downward-opening parabola.
Example 2

Determine whether each parabola opens upward or downward:

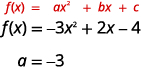
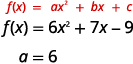
ⓐ \(f(x)=-3{x}^{2}+2x-4\) ⓑ \(f(x)=6{x}^{2}+7x-9.\)

Identify the value of \(a\) in each function — its sign tells you whether the parabola opens upward or downward.


Table 2
Find the value of “a”.A mathematical image shows the general quadratic equation f(x) = ax^2 + bx + c, followed by a specific instance f(x) = -3x^2 + 2x - 4, and then explicitly states that a = -3.
Since the “a” is negative, the parabola will open downward.


Table 3
Find the value of “a”.The image displays the general form of a quadratic function, f(x) = ax^2 + bx + c, followed by a specific example, f(x) = 6x^2 + 7x - 9, and identifies the value of 'a' as 6.
Since the “a” is positive, the parabola will open upward.
Try It #3

Determine whether the graph of each function is a parabola that opens upward or downward:

ⓐ \(f(x)=2{x}^{2}+5x-2\) ⓑ \(f(x)=-3{x}^{2}-4x+7.\)

ⓐ up; ⓑ down

Did you get it?
Try It #4

Determine whether the graph of each function is a parabola that opens upward or downward:

ⓐ \(f(x)=-2{x}^{2}-2x-3\) ⓑ \(f(x)=5{x}^{2}-2x-1.\)

ⓐ down; ⓑ up

Did you get it?

Find the Axis of Symmetry and Vertex of a Parabola

Look again at Figure 1. Do you see that we could fold each parabola in half and then one side would lie on top of the other? The ‘fold line’ is a line of symmetry. We call it the axis of symmetry of the parabola.

We show the same two graphs again with the axis of symmetry. See Figure 2.
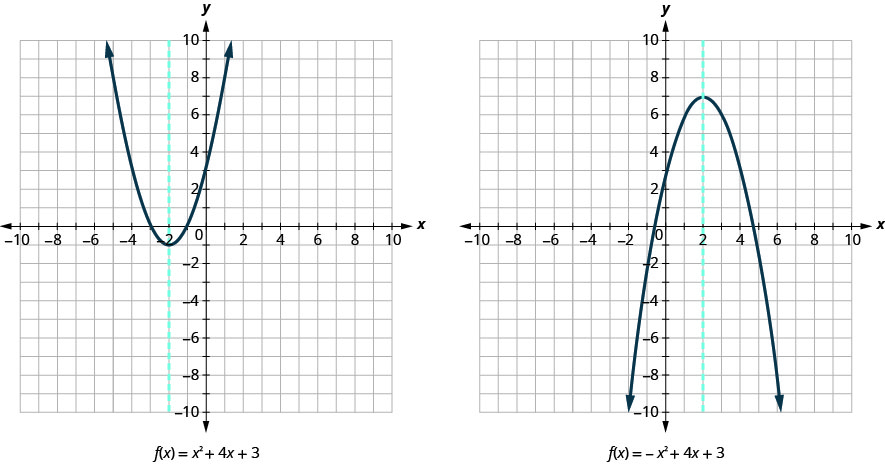
This image shows 2 graphs side-by-side. The graph on the left shows an upward-opening parabola and a dashed vertical line graphed on the x y-coordinate plane. The x-axis of the plane runs from negative 10 to 10. The y-axis of the plane runs from negative 10 to 10. The parabola has a vertex at (negative 2, negative 1) and passes through the points (negative 4, 3) and (0, 3). The equation of this parabola is x squared plus 4 x plus 3. The vertical line passes through the point (negative 2, 0) and has the equation x equals negative 2. The graph on the right shows an downward-opening parabola and a dashed vertical line graphed on the x y-coordinate plane. The x-axis of the plane runs from negative 10 to 10. The y-axis of the plane runs from negative 10 to 10. The parabola has a vertex at (2, 7) and passes through the points (0, 3) and (4, 3). The equation of this parabola is negative x squared plus 4 x plus 3. The vertical line passes through the point (2, 0) and has the equation x equals 2.
Figure 2

The equation of the axis of symmetry can be derived by using the Quadratic Formula. We will omit the derivation here and proceed directly to using the result. The equation of the axis of symmetry of the graph of f (x) = ax2 + bx + c is \(x=-\frac{b}{2a}.\)

So to find the equation of symmetry of each of the parabolas we graphed above, we will substitute into the formula \(x=-\frac{b}{2a}.\)
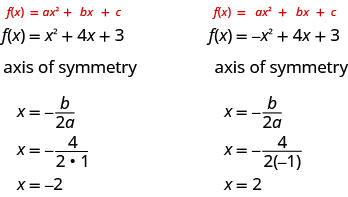
Compare the function f of x equals x squared plus 4 x plus 3 to the standard form of a quadratic function, f of x equals a x squared plus b x plus c. The axis of symmetry is the line x equals negative b divided by the product 2 a. Substituting for b and a yields x equals negative 4 divided by the product 2 times 1. The axis of symmetry equals negative 2. Next, compare the function f of x equals negative x squared plus 4 x plus 3 to the standard form of a quadratic function, f of x equals a x squared plus b x plus c. The axis of symmetry is the line x equals negative b divided by the product 2 a. Substituting for b and a yields x equals negative 4 divided by the product 2 times negative 1. The axis of symmetry equals 2.

Notice that these are the equations of the dashed blue lines on the graphs.

The point on the parabola that is the lowest (parabola opens up), or the highest (parabola opens down), lies on the axis of symmetry. This point is called the vertex of the parabola.

We can easily find the coordinates of the vertex, because we know it is on the axis of symmetry. This means its
x-coordinate is \(-\frac{b}{2a}.\) To find the y-coordinate of the vertex we substitute the value of the x-coordinate into the quadratic function.
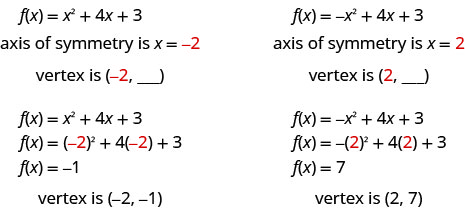
For the function f of x equals x squared plus 4 x plus 3, the axis of symmetry is x equals negative 2. The vertex is the point on the parabola with x-coordinate negative 2. Substitute x equals negative 2 into the function f of x equals x squared plus 4 x plus 3. F of x equals the square of negative 2 plus 4 times negative 2 plus 3, so f of x equals negative 1. The vertex is the point (negative 2, negative 1). For the function f of x equals negative x squared plus 4 x plus 3, the axis of symmetry is x equals 2. The vertex is the point on the parabola with x-coordinate 2. Substitute x equals 2 into the function f of x equals x squared plus 4 x plus 3. F of x equals 2 squared plus 4 times 2 plus 3, so f of x equals 7. The vertex is the point (2, 7).
Axis of Symmetry and Vertex of a Parabola

The graph of the function f (x) = ax2 + bx + c is a parabola where:

  • the axis of symmetry is the vertical line \(x=-\frac{b}{2a}.\)
  • the vertex is a point on the axis of symmetry, so its x-coordinate is \(-\frac{b}{2a}.\)
  • the y-coordinate of the vertex is found by substituting \(x=-\frac{b}{2a}\) into the quadratic equation.
Example 3

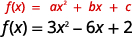
For the graph of \(f(x)=3{x}^{2}-6x+2\) find:

ⓐ the axis of symmetry ⓑ the vertex.

Substitute \(a\) and \(b\) into \(x=-\frac{b}{2a}\) to get the axis of symmetry, then evaluate the function there for the vertex.


Table 4
The general quadratic equation f(x) = ax^2 + bx + c is shown above a specific example: f(x) = 3x^2 - 6x + 2.
The axis of symmetry is the vertical line
\(x=-\frac{b}{2a}\) .
Substitute the values of \(a,b\) into the
equation.
An algebraic equation X = -(-6 / (2 * 3)) is shown on a white background.
Simplify.The image displays the mathematical equation 'x = 1' in black text on a plain white background, indicating that the variable x has a value of one.
The axis of symmetry is the line \(x=1\) .


Table 5
A mathematical equation is presented, showing a quadratic function written in standard form: f(x) = 3x^2 - 6x + 2.
The vertex is a point on the line of
symmetry, so its x-coordinate will be
\(x=1\) .
Find \(f(1)\) .
The image shows the evaluation of a quadratic function at x=1, represented as f(1) = 3(1)^2 - 6(1) + 2.
Simplify.A mathematical equation is displayed: f(1) = 3 * 1 - 6 + 2, where the number '1' being multiplied by 3 is highlighted in red, indicating a substitution or specific value for calculation.
The result is the y-coordinate.The mathematical equation f(1) = -1 is displayed in black text against a plain white background.
The vertex is \((1,-1)\) .
Try It #5

For the graph of \(f(x)=2{x}^{2}-8x+1\) find:

ⓐ the axis of symmetry ⓑ the vertex.

ⓐ \(x=2;\) ⓑ \((2,-7)\)

Did you get it?
Try It #6

For the graph of \(f(x)=2{x}^{2}-4x-3\) find:

ⓐ the axis of symmetry ⓑ the vertex.

ⓐ \(x=1;\) ⓑ \((1,-5)\)

Did you get it?

Find the Intercepts of a Parabola

When we graphed linear equations, we often used the x- and y-intercepts to help us graph the lines. Finding the coordinates of the intercepts will help us to graph parabolas, too.

Remember, at the y-intercept the value of x is zero. So to find the y-intercept, we substitute x = 0 into the function.

Let’s find the y-intercepts of the two parabolas shown in Figure 3.
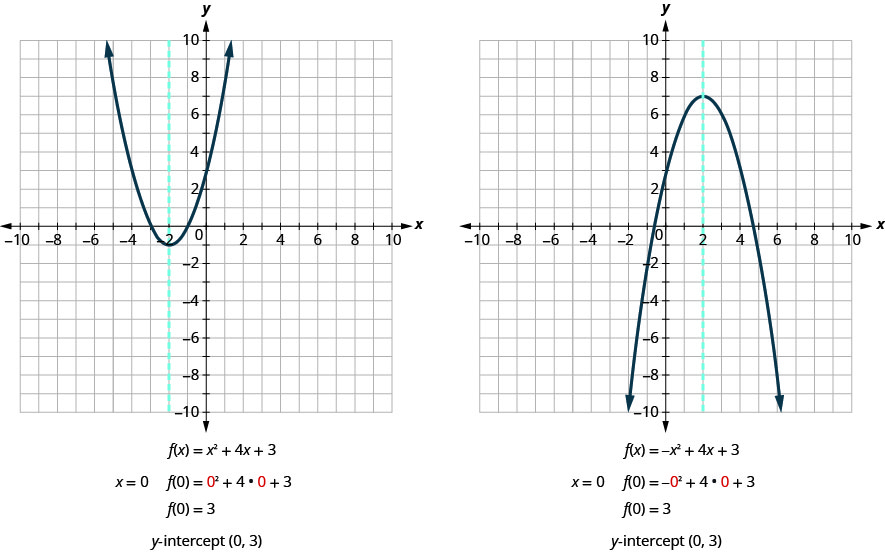
This image shows 2 graphs side-by-side. The graph on the left shows an upward-opening parabola and a dashed vertical line graphed on the x y-coordinate plane. The x-axis of the plane runs from negative 10 to 10. The y-axis of the plane runs from negative 10 to 10. The parabola has a vertex at (negative 2, negative 1) and passes through the points (negative 4, 3) and (0, 3). The vertical line is an axis of symmetry for the parabola, and passes through the point (negative 2, 0). It has the equation x equals negative 2. The equation of this parabola is x squared plus 4 x plus 3. When x equals 0, f of 0 equals 0 squared plus 4 times 0 plus 3. F of 0 equals 3. The y-intercept of the graph is the point (0, 3). The graph on the right shows an downward-opening parabola and a dashed vertical line graphed on the x y-coordinate plane. The x-axis of the plane runs from negative 10 to 10. The y-axis of the plane runs from negative 10 to 10. The parabola has a vertex at (2, 7) and passes through the points (0, 3) and (4, 3). The vertical line is an axis of symmetry for the parabola and passes through the point (2, 0). It has the equation x equals 2. The equation of this parabola is negative x squared plus 4 x plus 3. When x equals 0, f of 0 equals negative 0 squared plus 4 times 0 plus 3. F of 0 equals 3. The y-intercept of the graph is the point (0, 3).
Figure 3

An x-intercept results when the value of f (x) is zero. To find an x-intercept, we let f (x) = 0. In other words, we will need to solve the equation 0 = ax2 + bx + c for x.

\[\begin{array}{lll}f(x) & = & a{x}^{2}+bx+c \\ 0 & = & a{x}^{2}+bx+c\end{array}\]

Solving quadratic equations like this is exactly what we have done earlier in this chapter!

We can now find the x-intercepts of the two parabolas we looked at. First we will find the x-intercepts of the parabola whose function is f (x) = x2 + 4x + 3.

Table 6
The quadratic function f(x) = x^2 + 4x + 3 is displayed, representing a parabola in a mathematical context.
Let \(f(x)=0\) .The image shows the quadratic equation 0 = x^2 + 4x + 3, presented in a clear and concise format. The number 0 is highlighted in red, emphasizing the equation's form.
Factor.A mathematical equation shows 0 equals the product of (x + 1) and (x + 3), representing a quadratic equation in factored form.
Use the Zero Product Property.Two linear equations are shown: x + 1 = 0 and x + 3 = 0.
Solve.Two mathematical expressions are displayed: x = -1 and x = -3.
The x-intercepts are \((-1,0)\) and \((-3,0)\) .

Now we will find the x-intercepts of the parabola whose function is f (x) = −x2 + 4x + 3.

Table 7
The image displays the quadratic function f(x) = -x^2 + 4x + 3 written in a standard mathematical notation on a white background.
Let \(f(x)=0\) .A mathematical equation is displayed with a red zero, an equals sign, and the expression '-x^2 + 4x + 3' in black on a white background, representing a quadratic equation.
This quadratic does not factor, so
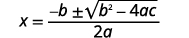
we use the Quadratic Formula.
The quadratic formula, x equals negative b plus or minus the square root of b squared minus 4ac, all divided by 2a, for solving quadratic equations.
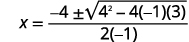
\(a=-1,b=4,c=3\)A step in solving a quadratic equation using the quadratic formula: x = (-4 plus or minus sqrt(4^2 - 4(-1)(3))) / (2(-1)).
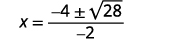
Simplify.A mathematical equation is displayed, showing 'x equals negative 4 plus or minus the square root of 28, all divided by negative 2' on a white background.
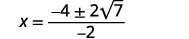
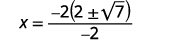
A mathematical equation shows x = (-4 ± 2√7) / -2. This expression simplifies to x = 2 ± √7, representing two possible values for x from a quadratic formula solution.
A mathematical equation displays x equals a fraction where the numerator is -2 multiplied by the quantity 2 plus or minus the square root of 7, and the denominator is -2.
A mathematical equation displaying x = 2 ± √7, showing the value of x as two plus or minus the square root of seven.
The x-intercepts are \((2+\sqrt{7},0)\) and
\((2-\sqrt{7},0)\) .

We will use the decimal approximations of the x-intercepts, so that we can locate these points on the graph,

\[\begin{array}{llllll}(2+\sqrt{7},0)\approx (4.6,0) & & & & & (2-\sqrt{7},0)\approx (-0.6,0)\end{array}\]

Do these results agree with our graphs? See Figure 4.
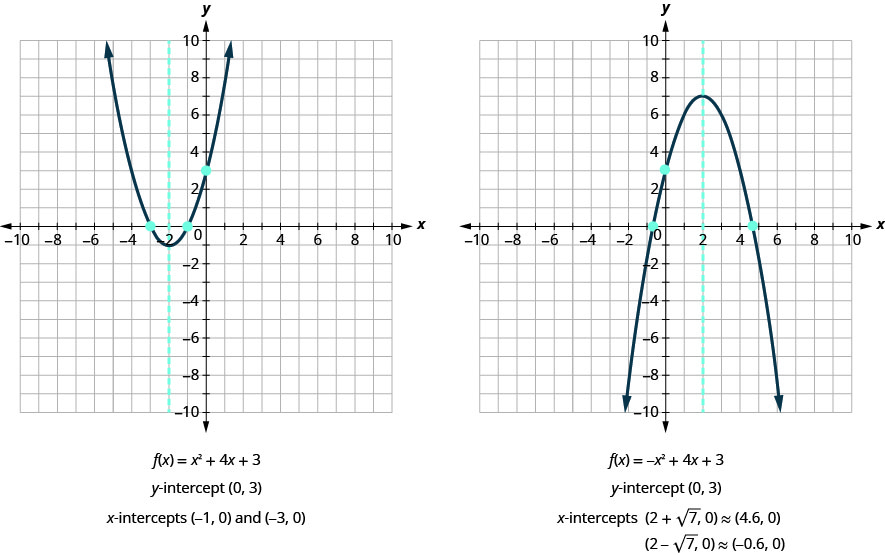
This image shows 2 graphs side-by-side. The graph on the left shows the upward-opening parabola defined by the function f of x equals x squared plus 4 x plus 3 and a dashed vertical line, x equals negative 2, graphed on the x y-coordinate plane. The x-axis of the plane runs from negative 10 to 10. The y-axis of the plane runs from negative 10 to 10. The parabola has a vertex at (negative 2, negative 1). The y-intercept is (0, 3) and the x-intercepts are (negative 1, 0) and (negative 3, 0). The graph on the right shows the downward-opening parabola defined by the function f of x equals negative x squared plus 4 x plus 3 and a dashed vertical line, x equals 2, graphed on the x y-coordinate plane. The x-axis of the plane runs from negative 10 to 10. The y-axis of the plane runs from negative 10 to 10. The parabola has a vertex at (2, 7). The y-intercept is (0, 3) and the x-intercepts are (2 plus square root 7, 0), approximately (4.6, 0) and (2 minus square root, 0), approximately (negative 0.6, 0).
Figure 4
Find the Intercepts of a Parabola

To find the intercepts of a parabola whose function is \(f(x)=a{x}^{2}+bx+c:\)

\[\begin{array}{llllll}\text{y}\text{-intercept} & & & & & \text{x}\text{-intercepts} \\ \text{Let}\,x=0\,\text{and solve for}\,f(x). & & & & & \text{Let}\,f(x)=0\,\text{and solve for}\,x.\end{array}\]

Example 4

Find the intercepts of the parabola whose function is \(f(x)={x}^{2}-2x-8.\)

Let \(x=0\) to find the y-intercept, then let \(f(x)=0\) and factor to find the x-intercepts.

Table 8
To find the y-intercept, let \(x=0\) and
solve for \(f(x)\) .
The image shows the quadratic function f(x) = x^2 - 2x - 8.
A mathematical equation shows f(0) equals 0 squared minus 2 multiplied by 0, minus 8. The '0' values in 0^2 and 2*0 are highlighted in red.
The mathematical equation f(0) = -8 is presented in a clear and concise format.
When \(x=0\) , then \(f(0)=-8\) .
The y-intercept is the point \((0,-8)\) .
To find the x-intercept, let \(f(x)=0\) and
solve for \(x\) .
The mathematical equation f(x) = x^2 - 2x - 8 is displayed.
A mathematical equation shows '0 = x^2 - 2x - 8' against a white background.
Solve by factoring.A mathematical equation is displayed with the number 0 on the left side, an equals sign in the middle, and the expression (x - 4)(x + 2) on the right side.
Two equations are shown side-by-side: 0 = x - 4 and 0 = x + 2. These represent two simple linear equations with variable x.
The mathematical expressions '4=X' and '-2=X' are shown, indicating a contradiction where the variable X is equated to two different values simultaneously.
When \(f(x)=0\) , then \(x=4\,\text{or}\,x=-2\) .
The x-intercepts are the points \((4,0)\) and
\((-2,0)\) .
Try It #7

Find the intercepts of the parabola whose function is \(f(x)={x}^{2}+2x-8.\)

y-intercept: \((0,-8)\) x-intercepts \((-4,0),(2,0)\)

Did you get it?
Try It #8

Find the intercepts of the parabola whose function is \(f(x)={x}^{2}-4x-12.\)

y-intercept: \((0,-12)\) x-intercepts \((-2,0),(6,0)\)

Did you get it?

In this chapter, we have been solving quadratic equations of the form ax2 + bx + c = 0. We solved for x and the results were the solutions to the equation.

We are now looking at quadratic functions of the form f (x) = ax2 + bx + c. The graphs of these functions are parabolas. The x-intercepts of the parabolas occur where f (x) = 0.

For example:

\[\begin{array}{lllllllll}\text{Quadratic equation} & & & & & & & & \,\text{Quadratic function} \\ \begin{array}{lll} \\ {x}^{2}-2x-15 & = & 0 \\ (x-5)(x+3) & = & 0 \\ x-5=0\,x+3 & = & 0 \\ x=5\,x & = & -3\end{array} & & & & \begin{array}{l}\text{Let}\,f(x)=0. \\ \\ \end{array} & & & & \,\begin{array}{lll}f(x) & = & {x}^{2}-2x-15 \\ 0 & = & {x}^{2}-2x-15 \\ 0 & = & (x-5)(x+3) \\ x-5 & = & 0\,x+3=0 \\ x & = & 5\,x=-3\end{array} \\ & & & & & & & & \,(5,0)\,\text{and}\,(-3,0) \\ & & & & & & & & \,x\text{-intercepts}\end{array}\]

The solutions of the quadratic function are the x values of the x-intercepts.

Earlier, we saw that quadratic equations have 2, 1, or 0 solutions. The graphs below show examples of parabolas for these three cases. Since the solutions of the functions give the x-intercepts of the graphs, the number of x-intercepts is the same as the number of solutions.

Previously, we used the discriminant to determine the number of solutions of a quadratic function of the form \(a{x}^{2}+bx+c=0.\) Now we can use the discriminant to tell us how many x-intercepts there are on the graph.
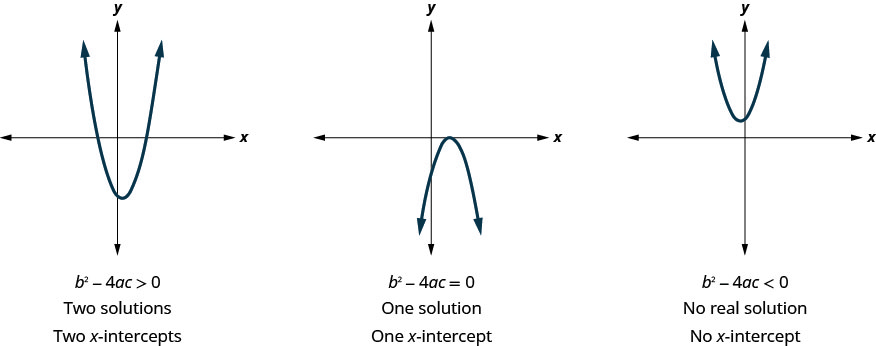
This image shows three graphs side-by-side. The graph on the left shows an upward-opening parabola graphed on the x y-coordinate plane. The vertex of the parabola lies below the x-axis and the parabola crosses the x-axis at two different points. If b squared minus 4 a c is greater than 0, then the quadratic equation a x squared plus b x plus c equals 0 has two solutions, and the graph of the parabola has 2 x-intercepts. The graph in the middle shows a downward-opening parabola graphed on the x y-coordinate plane. The vertex of the parabola lies on the x-axis, the only point of intersection between the parabola and the x-axis. If b squared minus 4 a c equals 0, then the quadratic equation a x squared plus b x plus c equals 0 has one solution, and the graph of the parabola has 1 x-intercept. The graph on the right shows an upward-opening parabola graphed on the x y-coordinate plane. The vertex of the parabola lies above the x-axis and the parabola does not cross the x-axis. If b squared minus 4 a c is less than 0, then the quadratic equation a x squared plus b x plus c equals 0 has no solutions, and the graph of the parabola has no x-intercepts.

Before you to find the values of the x-intercepts, you may want to evaluate the discriminant so you know how many solutions to expect.

Example 5

Find the intercepts of the parabola for the function \(f(x)=5{x}^{2}+x+4.\)

Find the y-intercept by evaluating \(f(0),\) then check the discriminant \(b^2-4ac\) before trying to solve for x-intercepts.

Table 9
The image displays the quadratic function f(x) = 5x^2 + x + 4.
To find the y-intercept, let \(x=0\) and
solve for \(f(x)\) .
A mathematical equation shows f(0) = 5 * 0^2 + 0 + 4, illustrating the substitution of 0 into a function, with the substituted zeros highlighted in red.
The mathematical equation f(0) = 4 is displayed in black text against a plain white background.
When \(x=0\) , then \(f(0)=4\) .
The y-intercept is the point \((0,4)\) .
To find the x-intercept, let \(f(x)=0\) and
solve for \(x\) .
A mathematical equation is displayed, showing f(x) = 5x^2 + x + 4 on a white background. This is a quadratic function, representing a parabola when graphed.
A mathematical equation is displayed: 0 = 5x^2 + x + 4.
Find the value of the discriminant to
predict the number of solutions which is
also the number of x-intercepts.
\(\begin{array}{l}{b}^{2}-4ac \\ {1}^{2}-4·5·4 \\ 1-80 \\ -79\end{array}\)
Since the value of the discriminant is
negative, there is no real solution to the
equation.
There are no x-intercepts.
Try It #9

Find the intercepts of the parabola whose function is \(f(x)=3{x}^{2}+4x+4.\)

y-intercept: \((0,4)\) no x-intercept

Did you get it?
Try It #10

Find the intercepts of the parabola whose function is \(f(x)={x}^{2}-4x-5.\)

y-intercept: \((0,-5)\) x-intercepts \((-1,0),(5,0)\)

Did you get it?

Graph Quadratic Functions Using Properties

Now we have all the pieces we need in order to graph a quadratic function. We just need to put them together. In the next example we will see how to do this.

Example 6How to Graph a Quadratic Function Using Properties

Graph f (x) = x2 −6x + 8 by using its properties.

Start by checking the sign of \(a\) to see which way the parabola opens, then find the axis of symmetry to locate the vertex.

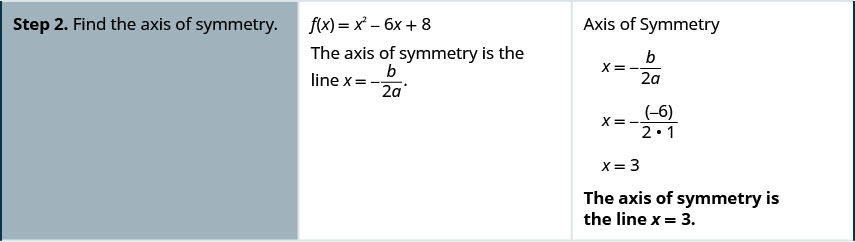
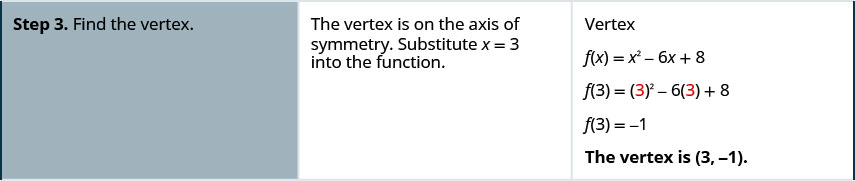
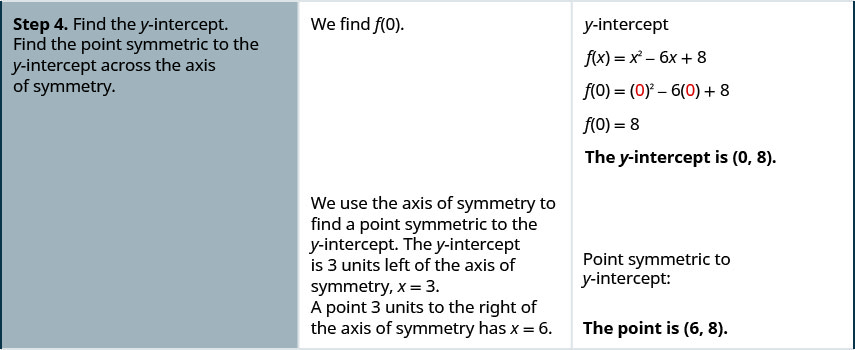
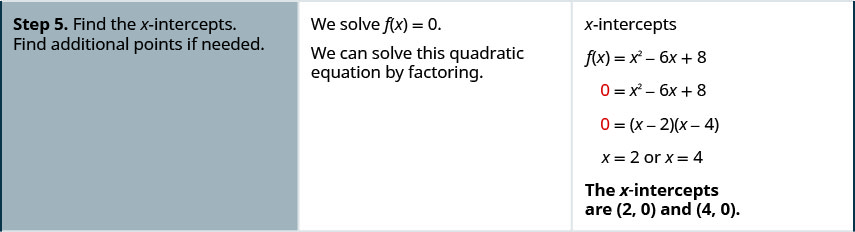
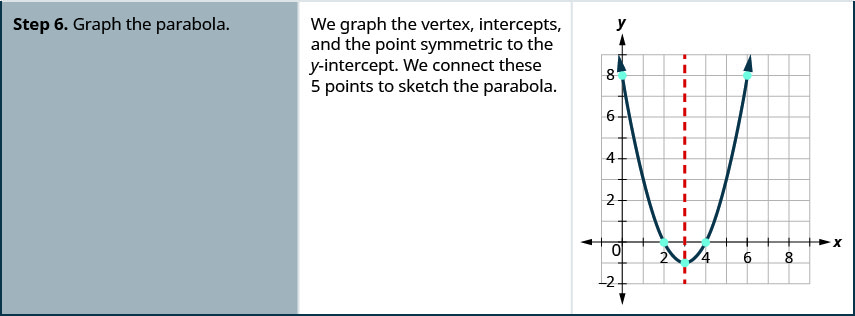
Step 1 is to determine whether the parabola opens upward or downward. Loot at the leading coefficient, a, in the equation. If f of x equals x squared minus 6 x plus 8, then a equals 1. Since a is positive, the parabola opens upward. Step 2 is to find the axis of symmetry. The axis of symmetry is the line x equals negative b divided by the product 2 a. For the function f of x equals x squared minust 6 x plus 8, the axis of symmetry is negative b divided by the product 2 a. x equals the opposite of negative 6 divided by the product 2 times 1. X equals 3. In step 3, find the vertex. The vertex is on the axis of symmetry. Substitute x equals 3 into the function. F of x equals x squared minus 6 x plus 8. F of 3 equals 3 squared minus 6 times 3 plus 8. F of 3 equals negative 1. The vertex is the point (3, negative 1). Step 4. Find the y-intercept. Find the point symmetric to the y-intercept across the axis of symmetry. We first find f of 0 to find the y-intercept. F of x equals x squared plus 6 x plus 8, so f of 0 equals 0 squared plus 6 times 0 plus 8. F of 0 equals 8. The y-intercept is the point (0, 8). We use the axis of symmetry to find a point symmetric to the y-intercept. The y-intercept is 3 units left of the axis of symmetry, x equals 3. A point 3 units to the right of the axis of symmetry has x-value 6. The point symmetric to the y-intercept is the point (6, 8). Step 5 is to find the x-intercepts. Find additional points if needed. We solve f of x equals 0. We can solve this quadratic equation by factoring. To find the x-intercepts, set f of x equal to 0. F of x equals x squared minus 6 x plus 8. 0 equals x squared minus 6 x plus 8. 0 equals the product of x minus 2 and x minus 4. So x equals 2 or x equals 4. The x-intercepts are the points (2, 0) and (4, 0). The final step, step 6, is to graph the parabola. We graph the vertex, intercepts, and the point symmetric to the y-intercept. We connect these 5 points to sketch the parabola. An image shows an upward-opening parabola graphed on the x y-coordinate plane. The x-axis of the plane runs from negative 2 to 10. The y-axis of the plane runs from negative 3 to 7. The parabola has a vertex at (3, negative 1). Other points plotted include the x-intercepts, (2, 0) and (4, 0), the y-intercept, (0, 8), and the point (6, 8) that is symmetric to the y-intercept across the axis of symmetry.
Try It #11

Graph f (x) = x2 + 2x − 8 by using its properties.
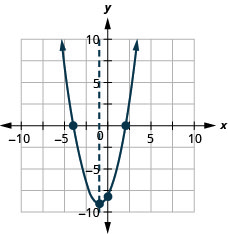
This figure shows an upward-opening parabola graphed on the x y-coordinate plane. The x-axis of the plane runs from negative 10 to 10. The y-axis of the plane runs from negative 10 to 10. The axis of symmetry, x equals negative 1, is graphed as a dashed line. The parabola has a vertex at (negative 1, negative 9). The y-intercept of the parabola is the point (0, negative 8). The x-intercepts of the parabola are the points (negative 4, 0) and (4, 0).
Did you get it?
Try It #12

Graph f (x) = x2 − 8x + 12 by using its properties.
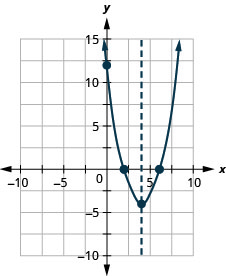
This figure shows an upward-opening parabola graphed on the x y-coordinate plane. The x-axis of the plane runs from negative 10 to 10. The y-axis of the plane runs from negative 10 to 15. The axis of symmetry, x equals 4, is graphed as a dashed line. The parabola has a vertex at (4, negative 4). The y-intercept of the parabola is the point (0, 12). The x-intercepts of the parabola are the points (2, 0) and (6, 0).
Did you get it?

We list the steps to take in order to graph a quadratic function here.

To graph a quadratic function using properties.
  • Determine whether the parabola opens upward or downward.
  • Find the equation of the axis of symmetry.
  • Find the vertex.
  • Find the y-intercept. Find the point symmetric to the y-intercept across the axis of symmetry.
  • Find the x-intercepts. Find additional points if needed.
  • Graph the parabola.

We were able to find the x-intercepts in the last example by factoring. We find the x-intercepts in the next example by factoring, too.

Example 7

Graph f (x) = –x2 + 6x − 9 by using its properties.

Find the axis of symmetry and vertex first — watch what happens when you try to find separate x-intercepts.

Table 10
Two mathematical equations are displayed: a general quadratic function f(x) = ax^2 + bx + c, and a specific instance f(x) = -x^2 + 6x - 9.
Since a is \(-1\) , the parabola opens downward.
A red, inverted U-shaped arrow with both ends pointing downwards, symbolizing a cycle, feedback loop, or a two-way process.
To find the equation of the axis of symmetry, use
\(x=-\frac{b}{2a}\) .
The image displays a mathematical equation on a white background. The equation shown is x = -b / 2a, which represents the x-coordinate of the vertex of a parabola in standard form.
A mathematical expression reads X = -6 / (2(-1)), showing a fraction with a negative sign, numerator 6, and denominator 2 multiplied by -1 in parentheses.
The image displays the mathematical equation X=3 against a white background.
The axis of symmetry is \(x=3\) .
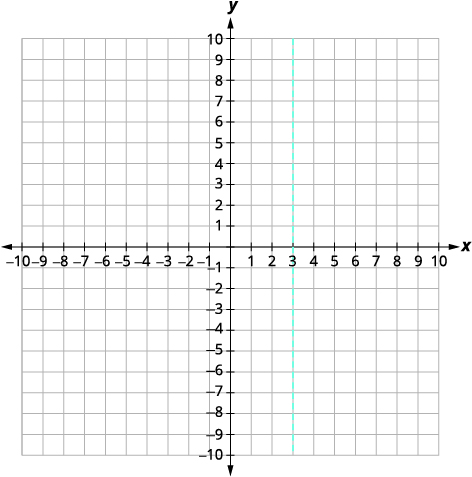
The vertex is on the line \(x=3\) .
A Cartesian coordinate system shows a vertical dashed line passing through x = 3. The x-axis ranges from -10 to 10, and the y-axis ranges from -10 to 10, with increments of 1 for both axes.
Find \(f(3)\) .The quadratic function f(x) = -x^2 + 6x - 9 is displayed on a white background.
A mathematical equation is displayed on a white background: f(3) = -3^2 + 6 * 3 - 9. The numbers '3' within the terms '-3^2' and '6' are highlighted in red, indicating a substitution or evaluation.
A mathematical equation is displayed, showing 'f(3) = -9 + 18 - 9' in the center of a white background. This is a function evaluation, and the right side simplifies to 0.
The mathematical equation f(3) = 0 is displayed on a white background.
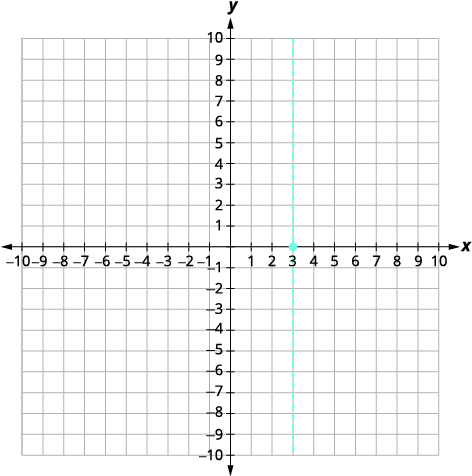
The vertex is \((3,0).\)
A graph displays a vertical dashed line passing through x=3 on a coordinate plane. The x and y axes range from -10 to 10, with a blue dot marking the line's intersection at (3,0).
The y-intercept occurs when \(x=0\) . Find \(f(0)\) .A mathematical equation for a quadratic function is displayed: f(x) = -x^2 + 6x - 9.
Substitute \(x=0\) .Substitution into a quadratic function: The equation f of x equals negative x squared plus six x minus nine is evaluated at x equals zero, demonstrating how to find the value of the function when zero is input.
Simplify.The image displays the mathematical expression 'f(0) = -9' centered on a white background.
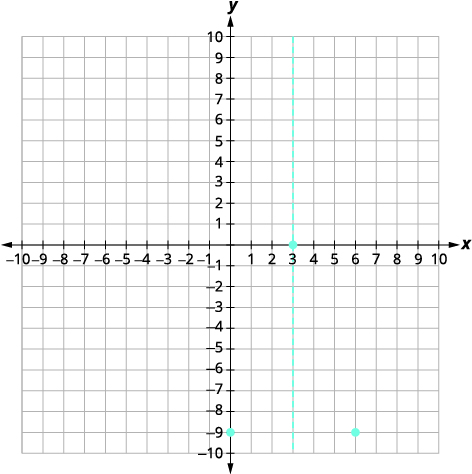
The y-intercept is \((0,-9).\)
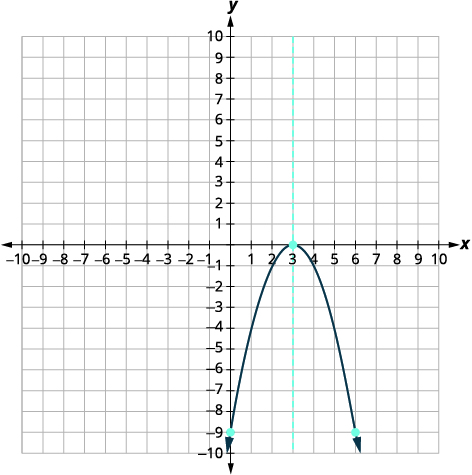
The point \((0,-9)\) is three units to the left of the line of symmetry. The point three units to the right of the line of symmetry is \((6,-9)\) .A coordinate plane displays a dashed vertical line at x=3. Two blue points are plotted: one at (0, -9) and another at (6, -9).
Point symmetric to the y-intercept is \((6,-9)\)
The x-intercept occurs when \(f(x)=0\) .The image displays the quadratic function f(x) = -x^2 + 6x - 9 on a white background.
Find \(f(x)=0\) .A quadratic equation, 0 = -x^2 + 6x - 9, is displayed on a white background, representing a mathematical expression.
Factor the GCF.The image shows the mathematical equation '0 = -(x^2 - 6x + 9)' centered on a white background, representing an algebraic expression likely for solving for x.
Factor the trinomial.The image displays the mathematical equation 0 = -(x - 3)^2, presented against a plain white background.
Solve for x.The number 0 equals 3, displayed as '0 = 3' in a simple, faded black font against a white background.
Connect the points to graph the parabola.Graph of a downward-opening parabola with vertex (3,0) and axis of symmetry x=3. The curve passes through (0,-9) and (6,-9).
Try It #13

Graph f (x) = −3x2 + 12x − 12 by using its properties.
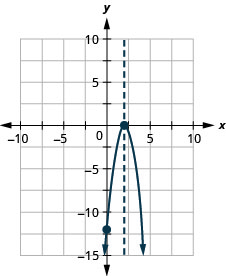
This figure shows a downward-opening parabola graphed on the x y-coordinate plane. The x-axis of the plane runs from negative 10 to 10. The y-axis of the plane runs from negative 15 to 10. The parabola has a vertex at (2, 0). The y-intercept (0, negative 12) is plotted as well as the axis of symmetry, x equals 2.
Did you get it?
Try It #14

Graph f (x) = 4x2 + 24x + 36 by using its properties.
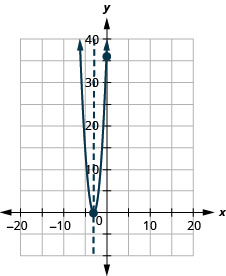
This figure shows an upward-opening parabola graphed on the x y-coordinate plane. The x-axis of the plane runs from negative 30 to 20. The y-axis of the plane runs from negative 10 to 40. The parabola has a vertex at (negative 3, 0). The y-intercept (0, 36) is plotted as well as the axis of symmetry, x equals negative 3.
Did you get it?

For the graph of f (x) = −x2 + 6x − 9, the vertex and the x-intercept were the same point. Remember how the discriminant determines the number of solutions of a quadratic equation? The discriminant of the equation 0 = −x2 + 6x − 9 is 0, so there is only one solution. That means there is only one x-intercept, and it is the vertex of the parabola.

How many x-intercepts would you expect to see on the graph of f (x) = x2 + 4x + 5?

Example 8

Graph f (x) = x2 + 4x + 5 by using its properties.

Find the vertex and y-intercept as usual, then check the discriminant before looking for x-intercepts.

Table 11
Two mathematical equations are displayed: the general form of a quadratic function, f(x) = ax^2 + bx + c, and a specific instance, f(x) = x^2 + 4x + 5.
Since a is 1, the parabola opens upward.
Two red arrows form a U-shape, pointing upwards, suggesting a connection or uplift.
To find the axis of symmetry, find \(x=-\frac{b}{2a}\) .The mathematical formula for finding the x-coordinate of the vertex of a parabola, x = -b / 2a, is displayed on a white background.
A mathematical equation is displayed on a white background, reading 'x = -4 / (2)1'.
The image shows x=-2.
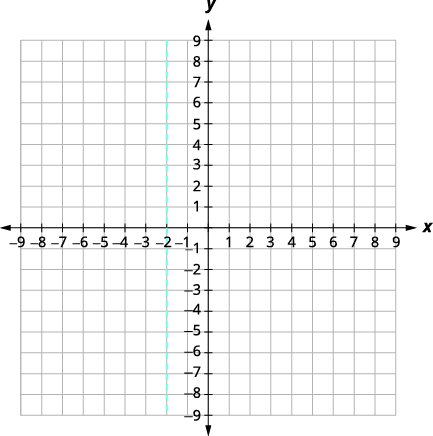
The equation of the axis of symmetry is \(x=-2\) .
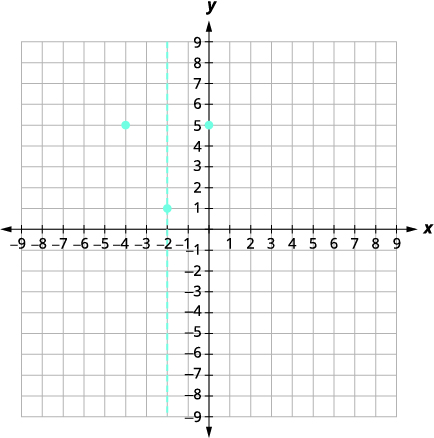
A coordinate plane with an x-axis ranging from -9 to 9 and a y-axis ranging from -9 to 9. A dashed vertical line is graphed at x = -2, extending across the entire y-range.
The vertex is on the line \(x=-2.\)
Find \(f(x)\) when \(x=-2.\)The image displays the quadratic function f(x) = x^2 + 4x + 5 written in black text against a white background.
A mathematical equation is displayed, showing the function f evaluated at -2: f(-2) = (-2)^2 + 4(-2) + 5, which involves squaring, multiplication, and addition.
A mathematical equation is displayed on a white background, reading 'f(-2) = 4 - 8 + 5' in black text.
The image displays the mathematical equation f(-2) = 1 centered on a white background.
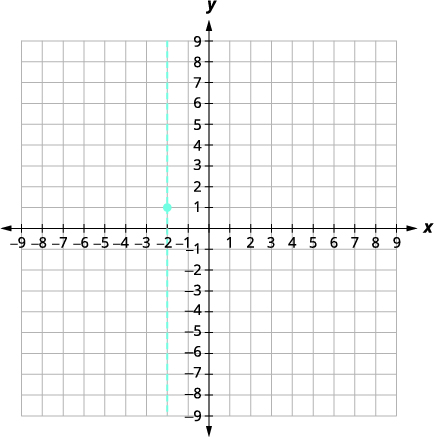
The vertex is \((-2,1)\) .
A coordinate plane shows a vertical dashed line passing through x = -2. A blue point is plotted on this line at (-2, 1). The x-axis and y-axis both range from -9 to 9.
The y-intercept occurs when \(x=0\) .A mathematical equation is displayed on a white background: f(x) = x^2 + 4x + 5.
Find \(f(0).\)The image displays the mathematical expression f(0) = 5 in black text against a plain white background, indicating that the function f evaluates to 5 when its input is 0.
Simplify.The image displays the mathematical expression f(0) = 5 in black text against a plain white background, indicating that the function f evaluates to 5 when its input is 0.
The y-intercept is \((0,5)\) .
The point \((-4,5)\) is two units to the left of the line of
symmetry.
The point two units to the right of the line of
symmetry is \((0,5)\) .
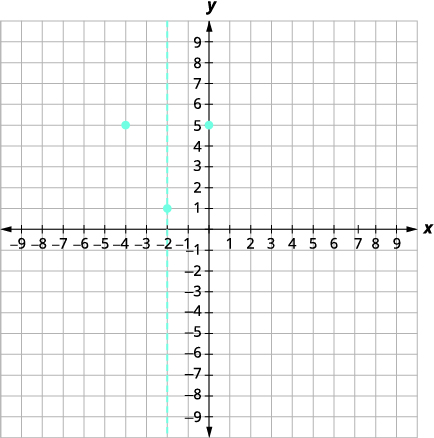
A graph on a coordinate plane shows a dashed vertical line at x = -2. Three points are plotted: (-4, 5), (-2, 1), and (0, 5).
Point symmetric to the y-intercept is \((-4,5)\) .
The x-intercept occurs when \(f(x)=0\) .A graph with three points: (-4, 5), (-2, 1), and (0, 5). A dashed vertical line is at x = -2, passing through the point (-2, 1) on the coordinate plane.
Find \(f(x)=0\) .The image shows the quadratic equation 0 = x^2 + 4x + 5.
Test the discriminant.
The mathematical expression b^2 - 4ac, which is the discriminant from the quadratic formula.
A mathematical expression displaying '4^2 - 4 * 1 * 5' against a white background.
A vertical image displays the numbers '15-20' in black text against a plain white background, appearing as if on a vertical sign or banner.
-4
Since the value of the discriminant is negative, there is
no real solution and so no x-intercept.
Connect the points to graph the parabola. You may
want to choose two more points for greater accuracy.
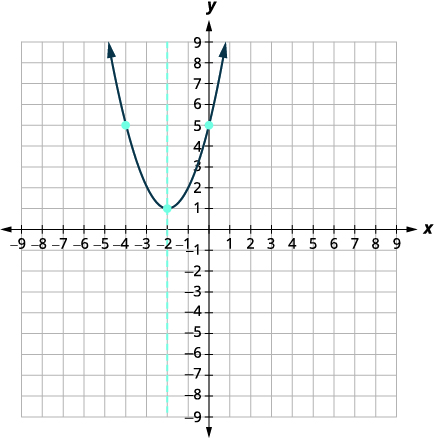
A parabola opens upwards with vertex at (-2, 1) and axis of symmetry at x = -2. The curve passes through points (-4, 5) and (0, 5).
Try It #15

Graph f (x) = x2 − 2x + 3 by using its properties.
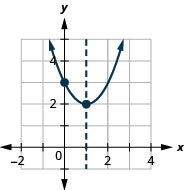

This figure shows an upward-opening parabola graphed on the x y-coordinate plane. The x-axis of the plane runs from negative 2 to 4. The y-axis of the plane runs from negative 1 to 5. The parabola has a vertex at (1, 2). The y-intercept (0, 3) is plotted as is the line of symmetry, x equals 1.
Did you get it?
Try It #16

Graph f (x) = −3x2 − 6x − 4 by using its properties.
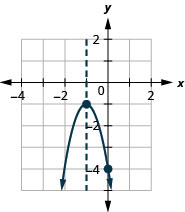

This figure shows a downward-opening parabola graphed on the x y-coordinate plane. The x-axis of the plane runs from negative 4 to 2. The y-axis of the plane runs from negative 5 to 1. The parabola has a vertex at (negative 1, negative 2). The y-intercept (0, negative 4) is plotted as is the line of symmetry, x equals negative 1.
Did you get it?

Finding the y-intercept by finding f (0) is easy, isn’t it? Sometimes we need to use the Quadratic Formula to find the x-intercepts.

Example 9

Graph f (x) = 2x2 − 4x − 3 by using its properties.

After finding the vertex and y-intercept, notice this trinomial doesn't factor nicely — you'll need the Quadratic Formula for the x-intercepts.

Table 12
Two mathematical equations are displayed: a general form of a quadratic function, f(x) = ax^2 + bx + c, and a specific example, f(x) = 2x^2 - 4x - 3, on a white background.
Since a is 2, the parabola opens upward.A vibrant red U-shaped graphic featuring two distinct arrowheads, both pointing directly upwards, signifying an upward trend, connection, or flow. A clear visual for growth or movement.
To find the equation of the axis of symmetry, use
\(x=-\frac{b}{2a}\) .
A mathematical formula is displayed as 'x = -b / 2a' against a white background.
A mathematical equation is displayed on a white background: X = -4 / (2 * 2). The formula simplifies to X = -4/4, which means X = -1.
The equation 'X = 1' is displayed on a plain white background.
The equation of the axis of
symmetry is \(x=1.\)
The vertex is on the line \(x=1\) .A mathematical expression displays the quadratic function f(x) = 2x^2 - 4x - 3, presented in a bold, sans-serif font on a white background.
Find \(f(1)\) .The image shows the equation f(x) = 2(1)^2 - 4(1) - 3.
The image shows the mathematical equation f(1) = 2 - 4 - 3 in black text on a white background.
A mathematical expression reads f(1) = -5, representing a function f evaluated at 1 resulting in a value of -5.
The vertex is \((1,-5).\)
The y-intercept occurs when \(x=0\) .The image displays the quadratic function f(x) = 2x^2 - 4x - 3.
Find \(f(0)\) .The image shows the evaluation of a quadratic function at x=0, specifically f(0) = 2(0)^2 - 4(0) - 3, simplifying to -3.
Simplify.The mathematical equation 'f(0) = -3' is displayed on a plain white background.
The y-intercept is \((0,-3).\)
The point \((0,-3)\) is one unit to the left of the line of
symmetry.
Point symmetric to the
y-intercept is \((2,-3)\)
The point one unit to the right of the line of
symmetry is \((2,-3)\) .
The x-intercept occurs when \(y=0\) .A mathematical equation for a quadratic function, f(x) = 2x^2 - 4x - 3, displayed in black text on a white background.
Find \(f(x)=0\) .A mathematical equation is displayed, reading '0 = 2x^2 - 4x - 3' on a white background.
Use the Quadratic Formula.The quadratic formula, used to find the roots of a quadratic equation, displayed as x = (-b +/- sqrt(b^2 - 4ac)) / (2a).
Substitute in the values of \(a,b,\) and \(c.\)An instance of the quadratic formula used to solve for x, showing the values -4, 2, and 3 substituted into the standard algebraic expression.
Simplify.A quadratic formula step showing X equals negative 4 plus or minus the square root of 16 plus 24, all divided by 4.
Simplify inside the radical.A mathematical equation is displayed on a white background: x = (4 ± √40) / 4. This represents the solution to a quadratic equation, showing the plus or minus operation for the square root of 40.
Simplify the radical.The image displays the mathematical equation for x: x = (4 plus or minus 2 times the square root of 10) / 4.
Factor the GCF.A mathematical equation showing x equals two times two plus or minus the square root of ten, all divided by four. This simplifies to x = (2 ±  10)/2.
Remove common factors.A mathematical equation showing x equals 2 plus or minus the square root of 10, all divided by 2.
Write as two equations.Two solutions for x are displayed: x equals (2 plus the square root of 10) all over 2, and x equals (2 minus the square root of 10) all over 2.
Approximate the values.Two mathematical approximations are displayed: x is approximately equal to 2.5, and x is approximately equal to -0.6. The text is clear and centrally placed on a plain white background.
The approximate values of the
x-intercepts are \((2.5,0)\) and
\((-0.6,0).\)
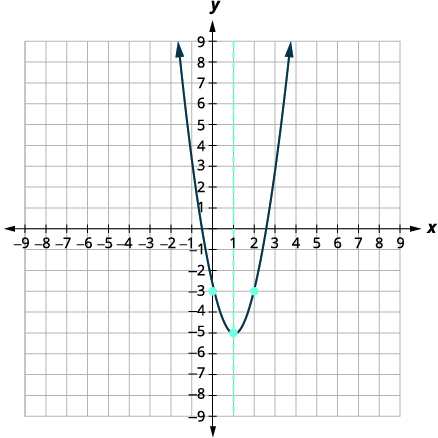
Graph the parabola using the points found.A parabola is graphed on a coordinate plane, with x and y axes ranging from -9 to 9. The parabola opens upwards, with its vertex at (1, -5). A dashed line at x=1 represents the axis of symmetry.
Try It #17

Graph f (x) = 5x2 + 10x + 3 by using its properties.
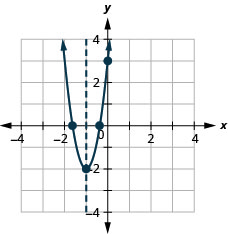
This figure shows an upward-opening parabola graphed on the x y-coordinate plane. The x-axis of the plane runs from negative 4 to 4. The y-axis of the plane runs from negative 4 to 4. The axis of symmetry, x equals negative 1, is graphed as a dashed line. The parabola has a vertex at (negative 1, negative 2). The y-intercept of the parabola is the point (0, 3). The x-intercepts of the parabola are approximately (negative 1.6, 0) and (negative 0.4, 0).
Did you get it?
Try It #18

Graph f (x) = −3x2 − 6x + 5 by using its properties.
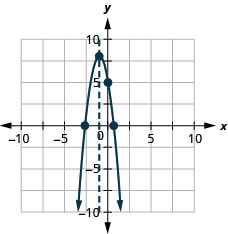
This figure shows a downward-opening parabola graphed on the x y-coordinate plane. The x-axis of the plane runs from negative 10 to 10. The y-axis of the plane runs from negative 10 to 10. The axis of symmetry, x equals negative 1, is graphed as a dashed line. The parabola has a vertex at (negative 1, 8). The y-intercept of the parabola is the point (0, 5). The x-intercepts of the parabola are approximately (negative 2.6, 0) and (0.6, 0).
Did you get it?

Solve Maximum and Minimum Applications

Knowing that the vertex of a parabola is the lowest or highest point of the parabola gives us an easy way to determine the minimum or maximum value of a quadratic function. The y-coordinate of the vertex is the minimum value of a parabola that opens upward. It is the maximum value of a parabola that opens downward. See Figure 5.
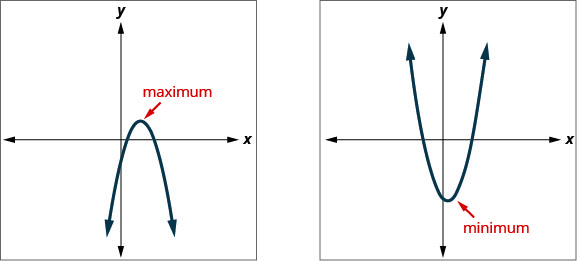
This figure shows 2 graphs side-by-side. The left graph shows a downward opening parabola plotted in the x y-plane. An arrow points to the vertex with the label maximum. The right graph shows an upward opening parabola plotted in the x y-plane. An arrow points to the vertex with the label minimum.
Figure 5
Minimum or Maximum Values of a Quadratic Function

The y-coordinate of the vertex of the graph of a quadratic function is the

  • minimum value of the quadratic equation if the parabola opens upward.
  • maximum value of the quadratic equation if the parabola opens downward.
Example 10

Find the minimum or maximum value of the quadratic function \(f(x)={x}^{2}+2x-8.\)

Decide whether the parabola opens up or down, then find the vertex — its y-coordinate is the minimum or maximum value.

Table 13
A mathematical equation is displayed on a white background, reading 'f(x) = x^2 + 2x - 8'.
Since a is positive, the parabola opens upward.
The quadratic equation has a minimum.
Find the equation of the axis of symmetry.Mathematical formula: x = -b/2a, representing the axis of symmetry or the x-coordinate of the vertex of a parabola.
The image displays a mathematical equation, x = -2 / (2 * 1), indicating a step in solving for x where the numerator is -2 and the denominator is the product of 2 and 1.
A white background with the equation 'X = -1' written in black in the upper left corner.
The equation of the axis of
symmetry is \(x=-1\) .
The vertex is on the line \(x=-1\) .A mathematical equation is displayed against a white background, showing the function f(x) = x^2 + 2x - 8. The text is in a dark grey or black font.
Find \(f(-1)\) .A mathematical equation shows the evaluation of a function f(x) at x=-1, with the expression f(-1) = (-1)^2 + 2(-1) - 8. The number -1 is highlighted in red to emphasize the substitution.
A mathematical expression shows f(-1) equals 1 minus 2 minus 8, displayed in black text against a white background.
The mathematical equation f(-1) = -9 is displayed on a white background.
The vertex is \((-1,-9)\) .
Since the parabola has a minimum, the y-coordinate of
the vertex is the minimum y-value of the quadratic
equation.
The minimum value of the quadratic is \(-9\) and it
occurs when \(x=-1\) .
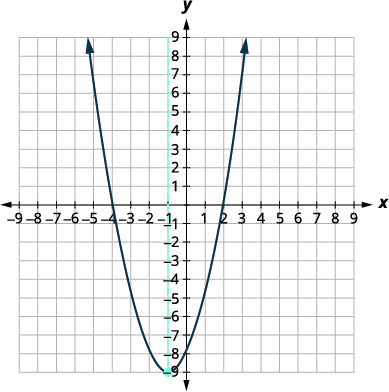
A graph of a parabola opening upwards, with its vertex at (-1, -9). A dashed vertical line at x = -1 indicates the axis of symmetry. The x and y axes both range from -9 to 9.
Show the graph to verify the result.
Try It #19

Find the maximum or minimum value of the quadratic function \(f(x)={x}^{2}-8x+12.\)

The minimum value of the quadratic function is −4 and it occurs when x = 4.

Did you get it?
Try It #20

Find the maximum or minimum value of the quadratic function \(f(x)=-4{x}^{2}+16x-11.\)

The maximum value of the quadratic function is 5 and it occurs when x = 2.

Did you get it?

We have used the formula

\[h(t)=-16{t}^{2}+{v}_{0}t+{h}_{0}\]

to calculate the height in feet, h , of an object shot upwards into the air with initial velocity, v0, after t seconds .

This formula is a quadratic function, so its graph is a parabola. By solving for the coordinates of the vertex (t, h), we can find how long it will take the object to reach its maximum height. Then we can calculate the maximum height.

Example 11

The quadratic equation h(t) = −16t2 + 176t + 4 models the height of a volleyball hit straight upwards with velocity 176 feet per second from a height of 4 feet.

ⓐ How many seconds will it take the volleyball to reach its maximum height? ⓑ Find the maximum height of the volleyball.

The axis of symmetry gives the time of the maximum height; substitute that time back into \(h(t)\) for the height itself.


Table 14
\(\begin{array}{l}h(t)=-16{t}^{2}+176t+4\end{array}\)
Since a is negative, the parabola opens downward.
The quadratic function has a maximum.
Table 15
Find the equation of the axis of symmetry.\(\begin{array}{lll} \\ \\ t & = & -\frac{b}{2a} \\ t & = & -\frac{176}{2(-16)} \\ t & = & 5.5\end{array}\)
The equation of the axis of symmetry is \(t=5.5.\)
The vertex is on the line \(t=5.5.\)The maximum occurs when \(t=5.5\) seconds.
Table 16
Find \(h(5.5).\)


Use a calculator to simplify.
\(\begin{array}{lll} \\ h(t) & = & -16{t}^{2}+176t+4 \\ h(t) & = & -16{(5.5)}^{2}+176(5.5)+4 \\ h(t) & = & 488\end{array}\)
The vertex is \((5.5,488).\)

Since the parabola has a maximum, the h-coordinate of the vertex is the maximum value of the quadratic function.

The maximum value of the quadratic is 488 feet and it occurs when t = 5.5 seconds.

After 5.5 seconds, the volleyball will reach its maximum height of 488 feet.

Try It #21

Solve, rounding answers to the nearest tenth.

The quadratic function h(t) = −16t2 + 128t + 32 is used to find the height of a stone thrown upward from a height of 32 feet at a rate of 128 ft/sec. How long will it take for the stone to reach its maximum height? What is the maximum height?

It will take 4 seconds for the stone to reach its maximum height of 288 feet.

Did you get it?
Try It #22

A path of a toy rocket thrown upward from the ground at a rate of 208 ft/sec is modeled by the quadratic function of h(t) = −16t2 + 208t. When will the rocket reach its maximum height? What will be the maximum height?

It will 6.5 seconds for the rocket to reach its maximum height of 676 feet.

Did you get it?

Key Concepts

Section Exercises

Practice Makes Perfect

Recognize the Graph of a Quadratic Function

In the following exercises, graph the functions by plotting points.

4

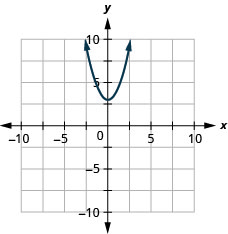
\(f(x)={x}^{2}+3\)

This figure shows an upward-opening parabola graphed on the x y-coordinate plane. The x-axis of the plane runs from negative 10 to 10. The y-axis of the plane runs from negative 10 to 10. The parabola has a vertex at (0, 3).
5

\(f(x)={x}^{2}-3\)

6

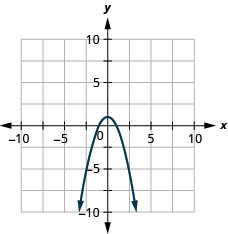
\(y=\text{-}{x}^{2}+1\)

This figure shows a downward-opening parabola graphed on the x y-coordinate plane. The x-axis of the plane runs from negative 10 to 10. The y-axis of the plane runs from negative 10 to 10. The parabola has a vertex at (0, 1).
7

\(f(x)=\text{-}{x}^{2}-1\)

For each of the following exercises, determine if the parabola opens up or down.

8

ⓐ \(f(x)=-2{x}^{2}-6x-7\) ⓑ \(f(x)=6{x}^{2}+2x+3\)

ⓐ down ⓑ up

9

ⓐ \(f(x)=4{x}^{2}+x-4\) ⓑ \(f(x)=-9{x}^{2}-24x-16\)

10

ⓐ \(f(x)=-3{x}^{2}+5x-1\) ⓑ \(f(x)=2{x}^{2}-4x+5\)

ⓐ down ⓑ up

11

ⓐ \(f(x)={x}^{2}+3x-4\) ⓑ \(f(x)=-4{x}^{2}-12x-9\)

Find the Axis of Symmetry and Vertex of a Parabola

In the following functions, find ⓐ the equation of the axis of symmetry and ⓑ the vertex of its graph.

12

\(f(x)={x}^{2}+8x-1\)

ⓐ \(x=-4\) ; ⓑ \((-4,-17)\)

13

\(f(x)={x}^{2}+10x+25\)

14

\(f(x)=\text{-}{x}^{2}+2x+5\)

ⓐ \(x=1\) ; ⓑ \((1,6)\)

15

\(f(x)=-2{x}^{2}-8x-3\)

Find the Intercepts of a Parabola

In the following exercises, find the intercepts of the parabola whose function is given.

16

\(f(x)={x}^{2}+7x+6\)

y-intercept: \((0,6);\) x-intercept \((-1,0),(-6,0)\)

17

\(f(x)={x}^{2}+10x-11\)

18

\(f(x)={x}^{2}+8x+12\)

y-intercept: \((0,12);\) x-intercept \((-2,0),(-6,0)\)

19

\(f(x)={x}^{2}+5x+6\)

20

\(f(x)=\text{-}{x}^{2}+8x-19\)

y-intercept: \((0,-19);\) x-intercept: none

21

\(f(x)=-3{x}^{2}+x-1\)

22

\(f(x)={x}^{2}+6x+13\)

y-intercept: \((0,13);\) x-intercept: none

23

\(f(x)={x}^{2}+8x+12\)

24

\(f(x)=4{x}^{2}-20x+25\)

y-intercept: \((0,25);\) x-intercept \((\frac{5}{2},0)\)

25

\(f(x)=\text{-}{x}^{2}-14x-49\)

26

\(f(x)=\text{-}{x}^{2}-6x-9\)

y-intercept: \((0,-9);\) x-intercept \((-3,0)\)

27

\(f(x)=4{x}^{2}+4x+1\)

Graph Quadratic Functions Using Properties

In the following exercises, graph the function by using its properties.

28

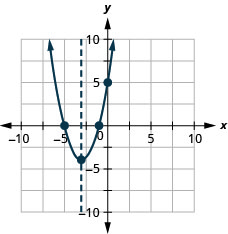
\(f(x)={x}^{2}+6x+5\)

This figure shows an upward-opening parabola graphed on the x y-coordinate plane. The x-axis of the plane runs from negative 10 to 10. The y-axis of the plane runs from negative 10 to 10. The parabola has a vertex at (negative 3, negative 4). The y-intercept, point (0, 5), is plotted as are the x-intercepts, (negative 5, 0) and (negative 1, 0).
29

\(f(x)={x}^{2}+4x-12\)

30

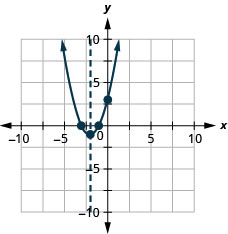
\(f(x)={x}^{2}+4x+3\)

This figure shows an upward-opening parabola graphed on the x y-coordinate plane. The x-axis of the plane runs from negative 10 to 10. The y-axis of the plane runs from negative 10 to 10. The parabola has a vertex at (negative 2, negative 1). The y-intercept, point (0, 3), is plotted as are the x-intercepts, (negative 3, 0) and (negative 1, 0).
31

\(f(x)={x}^{2}-6x+8\)

32

\(f(x)=9{x}^{2}+12x+4\)

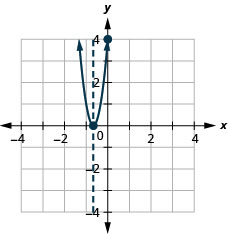
This figure shows an upward-opening parabola graphed on the x y-coordinate plane. The x-axis of the plane runs from negative 4 to 4. The y-axis of the plane runs from negative 4 to 4. The parabola has a vertex at (negative 2 thirds, 0). The y-intercept, point (0, 4), is plotted. The axis of symmetry, x equals negative 2 thirds, is plotted as a dashed vertical line.
33

\(f(x)=\text{-}{x}^{2}+8x-16\)

34

\(f(x)=\text{-}{x}^{2}+2x-7\)

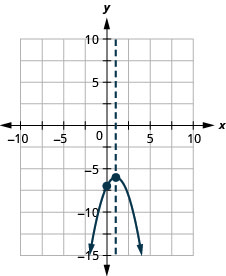
This figure shows a downward-opening parabola graphed on the x y-coordinate plane. The x-axis of the plane runs from negative 10 to 10. The y-axis of the plane runs from negative 15 to 10. The parabola has a vertex at (1, negative 6). The y-intercept, point (0, negative 7), is plotted. The axis of symmetry, x equals 1, is plotted as a dashed vertical line.
35

\(f(x)=5{x}^{2}+2\)

36

\(f(x)=2{x}^{2}-4x+1\)

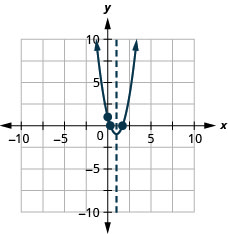
This figure shows an upward-opening parabola graphed on the x y-coordinate plane. The x-axis of the plane runs from negative 10 to 10. The y-axis of the plane runs from negative 10 to 10. The parabola has a vertex at (1, negative 1). The y-intercept, point (0, 1), is plotted as are the x-intercepts, approximately (0.3, 0) and (1.7, 0). The axis of symmetry is the vertical line x equals 1, plotted as a dashed line.
37

\(f(x)=3{x}^{2}-6x-1\)

38

\(f(x)=2{x}^{2}-4x+2\)

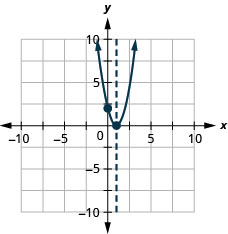
This figure shows an upward-opening parabola graphed on the x y-coordinate plane. The x-axis of the plane runs from negative 10 to 10. The y-axis of the plane runs from negative 10 to 10. The parabola has a vertex at (1, 0). This point is the only x-intercept. The y-intercept, point (0, 2), is plotted. The axis of symmetry is the vertical line x equals 1, plotted as a dashed line.
39

\(f(x)=-4{x}^{2}-6x-2\)

40

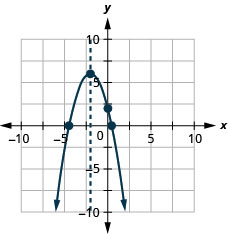
\(f(x)=\text{-}{x}^{2}-4x+2\)

This figure shows a downward-opening parabola graphed on the x y-coordinate plane. The x-axis of the plane runs from negative 10 to 10. The y-axis of the plane runs from negative 10 to 10. The parabola has a vertex at (negative 2, 6). The y-intercept, point (0, 2), is plotted as are the x-intercepts, approximately (negative 4.4, 0) and (0.4, 0). The axis of symmetry is the vertical line x equals 2, plotted as a dashed line.
41

\(f(x)={x}^{2}+6x+8\)

42

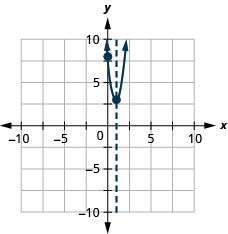
\(f(x)=5{x}^{2}-10x+8\)

This figure shows an upward-opening parabola graphed on the x y-coordinate plane. The x-axis of the plane runs from negative 10 to 10. The y-axis of the plane runs from negative 10 to 10. The parabola has a vertex at (1, 3). The y-intercept, point (0, 8), is plotted; there are no x-intercepts. The axis of symmetry is the vertical line x equals 1, plotted as a dashed line.
43

\(f(x)=-16{x}^{2}+24x-9\)

44

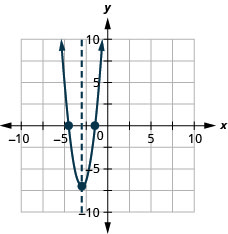
\(f(x)=3{x}^{2}+18x+20\)

This figure shows an upward-opening parabola graphed on the x y-coordinate plane. The x-axis of the plane runs from negative 10 to 10. The y-axis of the plane runs from negative 10 to 10. The parabola has a vertex at (negative 3, negative 7). The x-intercepts are plotted at the approximate points (negative 4.5, 0) and (negative 1.5, 0). The axis of symmetry is the vertical line x equals negative 3, plotted as a dashed line.
45

\(f(x)=-2{x}^{2}+8x-10\)

Solve Maximum and Minimum Applications

In the following exercises, find the maximum or minimum value of each function.

46

\(f(x)=2{x}^{2}+x-1\)

The minimum value is \(-\frac{9}{8}\) when \(x=-\frac{1}{4}.\)

47

\(y=-4{x}^{2}+12x-5\)

48

\(y={x}^{2}-6x+15\)

The minimum value is 6 when x = 3.

49

\(y=\text{-}{x}^{2}+4x-5\)

50

\(y=-9{x}^{2}+16\)

The maximum value is 16 when x = 0.

51

\(y=4{x}^{2}-49\)

In the following exercises, solve. Round answers to the nearest tenth.

52

An arrow is shot vertically upward from a platform 45 feet high at a rate of 168 ft/sec. Use the quadratic function h(t) = −16t2 + 168t + 45 find how long it will take the arrow to reach its maximum height, and then find the maximum height.

In 5.3 sec the arrow will reach maximum height of 486 ft.

53

A stone is thrown vertically upward from a platform that is 20 feet height at a rate of 160 ft/sec. Use the quadratic function h(t) = −16t2 + 160t + 20 to find how long it will take the stone to reach its maximum height, and then find the maximum height.

54

A ball is thrown vertically upward from the ground with an initial velocity of 109 ft/sec. Use the quadratic function h(t) = −16t2 + 109t + 0 to find how long it will take for the ball to reach its maximum height, and then find the maximum height.

In 3.4 seconds the ball will reach its maximum height of 185.6 feet.

55

A ball is thrown vertically upward from the ground with an initial velocity of 122 ft/sec. Use the quadratic function h(t) = −16t2 + 122t + 0 to find how long it will take for the ball to reach its maximum height, and then find the maximum height.

56

A computer store owner estimates that by charging x dollars each for a certain computer, he can sell 40 − x computers each week. The quadratic function R(x) = −x2 +40x is used to find the revenue, R, received when the selling price of a computer is x, Find the selling price that will give him the maximum revenue, and then find the amount of the maximum revenue.

A selling price of $20 per computer will give the maximum revenue of $400.

57

A retailer who sells backpacks estimates that by selling them for x dollars each, he will be able to sell 100 − x backpacks a month. The quadratic function R(x) = −x2 +100x is used to find the R, received when the selling price of a backpack is x. Find the selling price that will give him the maximum revenue, and then find the amount of the maximum revenue.

58

A retailer who sells fashion boots estimates that by selling them for x dollars each, he will be able to sell 70 − x boots a week. Use the quadratic function R(x) = −x2 +70x to find the revenue received when the average selling price of a pair of fashion boots is x. Find the selling price that will give him the maximum revenue, and then find the amount of the maximum revenue per day.

A selling price of $35 per pair of boots will give a maximum revenue of $1,225.

59

A cell phone company estimates that by charging x dollars each for a certain cell phone, they can sell 8 − x cell phones per day. Use the quadratic function R(x) = −x2 +8x to find the revenue received per day when the selling price of a cell phone is x. Find the selling price that will give them the maximum revenue per day, and then find the amount of the maximum revenue.

60

A rancher is going to fence three sides of a corral next to a river. He needs to maximize the corral area using 240 feet of fencing. The quadratic equation \(A(x)=x\left(120-\frac{x}{2}\right)\) gives the area of the corral, A, for the length, x, of the corral along the river. Find the length of the corral along the river that will give the maximum area, and then find the maximum area of the corral.

The length of one side along the river is 120 feet and the maximum are is 7,200 square feet.

61

A veterinarian is enclosing a rectangular outdoor running area against his building for the dogs he cares for. He needs to maximize the area using 100 feet of fencing. The quadratic function \(A(x)=x\left(50-\frac{x}{2}\right)\) gives the area, A, of the dog run for the length, x, of the building that will border the dog run. Find the length of the building that should border the dog run to give the maximum area, and then find the maximum area of the dog run.

62

A land owner is planning to build a fenced in rectangular patio behind his garage, using his garage as one of the “walls.” He wants to maximize the area using 80 feet of fencing. The quadratic function A(x) = x(80 − 2x) gives the area of the patio, where x is the width of one side. Find the maximum area of the patio.

The maximum area of the patio is 800 feet.

63

A family of three young children just moved into a house with a yard that is not fenced in. The previous owner gave them 300 feet of fencing to use to enclose part of their backyard. Use the quadratic function \(A(x)=x\left(150-\frac{x}{2}\right)\) determine the maximum area of the fenced in yard.

Writing Exercise

64

How do the graphs of the functions \(f(x)={x}^{2}\) and \(f(x)={x}^{2}-1\) differ? We graphed them at the start of this section. What is the difference between their graphs? How are their graphs the same?

Answers will vary.

65

Explain the process of finding the vertex of a parabola.

66

Explain how to find the intercepts of a parabola.

Answers will vary.

67

How can you use the discriminant when you are graphing a quadratic function?

Self Check

ⓐ After completing the exercises, use this checklist to evaluate your mastery of the objectives of this section.
This table provides a checklist to evaluate mastery of the objectives of this section. Choose how would you respond to the statement “I can recognize the graph of a quadratic equation.” “Confidently,” “with some help,” or “No, I don’t get it.” Choose how would you respond to the statement “I can find the axis of symmetry and vertex of a parabola.” “Confidently,” “with some help,” or “No, I don’t get it.” Choose how would you respond to the statement “I can find the intercepts of a parabola.” “Confidently,” “with some help,” or “No, I don’t get it.” Choose how would you respond to the statement “I can graph quadratic equations in two variables.” “Confidently,” “with some help,” or “No, I don’t get it.” Choose how would you respond to the statement “I can solve maximum and minimum applications.” “Confidently,” “with some help,” or “No, I don’t get it.”

ⓑ After looking at the checklist, do you think you are well-prepared for the next section? Why or why not?

Glossary

quadratic function
A quadratic function, where a, b, and c are real numbers and \(a\ne 0,\) is a function of the form \(f(x)=a{x}^{2}+bx+c.\)